


Weather
- Week
- Month
- Climate
- Climate - Tracking
- Maps (Climate)
- Audio
Forecast - Week - Tecpán Guatemala
Friday 3 Apr | Saturday 4 Apr | Sunday 5 Apr | Monday 6 Apr | Tuesday 7 Apr | Wednesday 8 Apr | Thursday 9 Apr |
22° 11° Partly cloudy | 22° 11° Partly cloudy | 21° 11° Mostly cloudy | 22° 11° Partly cloudy | 22° 10° Partly cloudy | 23° 11° Partly cloudy | 25° 11° Almost clear |
 4.9 mm (58%) 4.9 mm (58%) | 3.8 mm (77%) | 10.2 mm (89%) | 6.7 mm (97%) | 8.6 mm (95%) | 1.2 mm (73%) | 0.1 mm (36%) |
Conditions - Today - Tecpán Guatemala
| Visibility |
| partly cloudy 10 km / 6 mi |
Forecast - Week - Tecpán Guatemala
Today - Regional
| La Esperanza | Masagua | Antigua Guatemala | Nueva Santa Rosa | Samayac | Escuintla |
20° 9° | 36° 25° | 24° 13° | 30° 16° | 32° 20° | 34° 23° |
Month - Tecpán Guatemala (Updated: )
| Sunday | Monday | Tuesday | Wednesday | Thursday | Friday | Saturday | |||||||||||||||||||||||||||||||||||
|---|---|---|---|---|---|---|---|---|---|---|---|---|---|---|---|---|---|---|---|---|---|---|---|---|---|---|---|---|---|---|---|---|---|---|---|---|---|---|---|---|---|
3 April
Warm & Slight rain  4.9 mm (58%) 4.9 mm (58%)
 05:58-18:16 05:58-18:16 | 4 April
Warm & Showers 3.8 mm (77%)
05:57-18:16 | ||||||||||||||||||||||||||||||||||||||||
5 April
Cold & Showers 10.2 mm (89%)
05:56-18:16 | 6 April
Warm & Showers 6.7 mm (97%)
05:56-18:16 | 7 April
Warm & Thunder storms 8.6 mm (95%)
05:55-18:16 | 8 April
Warm & Showers 1.2 mm (73%)
05:54-18:17 | 9 April
Warm & Variable 0.1 mm (36%)
05:54-18:17 | 10 April
Warm & Almost clear
05:53-18:17 | 11 April
Warm & Variable 0.1 mm (46%)
05:52-18:17 | |||||||||||||||||||||||||||||||||||
12 April
Warm & Slight rain 0.2 mm (57%)
05:52-18:17 | 13 April
Warm & Slight rain 1.3 mm (70%)
05:51-18:17 | 14 April
Warm & Slight rain 1.3 mm (62%)
05:50-18:17 | 15 April
Warm & Showers 1.8 mm (65%)
05:50-18:18 | 16 April
Showers 73% chance05:49-18:18 | 17 April
Slight rain 30% chance05:48-18:18 | 18 April
Sunny 31% chance05:48-18:18 | |||||||||||||||||||||||||||||||||||
19 April
Sunny 32% chance05:47-18:18 | 20 April
Variable 33% chance05:47-18:18 | 21 April
Sunny 34% chance05:46-18:19 | 22 April
Sunny 35% chance05:45-18:19 | 23 April
Slight rain 36% chance05:45-18:19 | 24 April
Slight rain 37% chance05:44-18:19 | 25 April
Slight rain 38% chance05:44-18:19 | |||||||||||||||||||||||||||||||||||
26 April
Sunny 39% chance05:43-18:20 | 27 April
Variable 40% chance05:43-18:20 | 28 April
Sunny 41% chance05:42-18:20 | 29 April
Sunny 41% chance05:42-18:20 | 30 April
Variable 42% chance05:41-18:20 | 1 May
Slight rain 43% chance05:41-18:21 | 2 May
Slight rain 44% chance05:40-18:21 | |||||||||||||||||||||||||||||||||||
3 May
Showers 45% chance05:40-18:21 | 4 May
Sunny 46% chance05:39-18:21 | ||||||||||||||||||||||||||||||||||||||||
| Sunday | Monday | Tuesday | Wednesday | Thursday | Friday | Saturday |

Climate - Charts
Climate - Data
| Topic | Units | Jan | Feb | Mar | Apr | May | Jun | Jul | Aug | Sep | Oct | Nov | Dec |
|---|---|---|---|---|---|---|---|---|---|---|---|---|---|
| Humidity: relative (average) 4=High | % | 69 | 62 | 51 | 51 | 55 | 70 | 67 | 72 | 71 | 72 | 71 | 70 |
| Humidity: relative - am 4=High | % | 91 | 89 | 86 | 81 | 83 | 89 | 91 | 90 | 92 | 92 | 89 | 89 |
| Precipitation: days (average) 4=High | Days | 4 | 2 | 3 | 5 | 15 | 23 | 21 | 21 | 22 | 18 | 7 | 4 |
| Precipitation: total (average) 4=High | mm | 1 | 5 | 9 | 33 | 101 | 164 | 110 | 125 | 147 | 109 | 27 | 4 |
| Sunlight: hours (average) 4=High | hours | 5 | 5 | 5 | 4 | 3 | 1 | 2 | 1 | 2 | 2 | 3 | 5 |
| Temperature (average) 4=High | Celsius | 11 | 11 | 13 | 14 | 15 | 14 | 14 | 14 | 14 | 13 | 12 | 11 |
| Temperature: high (average) 4=High | Celsius | 25 | 27 | 28 | 29 | 29 | 27 | 27 | 27 | 26 | 25 | 25 | 24 |
| Temperature: highest (recorded) 4=High | Celsius | 30 | 30 | 31 | 34 | 33 | 30 | 30 | 30 | 28 | 30 | 29 | 30 |
| Temperature: low (average) 4=High | Celsius | 13 | 14 | 15 | 16 | 17 | 17 | 17 | 17 | 17 | 17 | 15 | 15 |
| Temperature: lowest (recorded) 4=High | Celsius | 6 | 6 | 6 | 8 | 10 | 9 | 10 | 10 | 11 | 8 | 8 | 6 |
| Dew Point - Afternoon (Average) 4=High | Celsius | 18.9 | 19.1 | 16.9 | 17.8 | 19 | 21 | 20.3 | 21.5 | 20.3 | 19.6 | 19.4 | 18.2 |
| Dew Point - night (Average) 4=High | Celsius | 11.6 | 12.2 | 12.7 | 12.7 | 14.1 | 15.2 | 15.5 | 15.3 | 15.7 | 15.7 | 13.2 | 13.2 |
| Heat Index 4=High | Celsius | 25 | 28.2 | 28.5 | 29.8 | 30.3 | 28.9 | 28.6 | 29 | 26 | 25 | 25 | 24 |
| Wind: speed (average) 1=Lowest | Beaufort | 2 | 2 | 2 | 2 | 2 | 2 | 2 | 2 | 2 | 2 | 2 | 2 |
| Wind: speed (average) 1=Lowest | wind speed (km/h) | 6-11 | 6-11 | 6-11 | 6-11 | 6-11 | 6-11 | 6-11 | 6-11 | 6-11 | 6-11 | 6-11 | 6-11 |
Sources
Estimates were extrapolated using statistical models (Kriging) from proximate reporting locations, based on a meta-analysis of numerous climate reports (e.g. BBC Climate, Climate Chart, Climate Temp, MSN Climate, National Oceanic and Atmospheric Administration Satellite and Information Service - Global Historical Climatology Network, Tokyo Climate Center, Weather Base, World Climate and World Weather). Proximity reflects the distances required for the extrapolations. For example, "Highest" indicates that the distances relied upon were less than 40 kilometers distant from existing measurement location. "High" indicates distances less than 60 kilometers, "Medium" indicates distances of less than 100 kilometers, "Low" indicates distances of less than 150 kilometers, and "Lowest" indicates distances greater than 150 kilometers. The more proximate the estimate, the more likely the estimates reflect local climatic conditions.
Methodology
The Wet Bulb Globe Temperature (WBGT) is a composite temperature used to estimate the effect of temperature, humidity, wind speed (wind chill) and solar radiation on humans. It is used by various professions, including industrial hygienists, athletes, and the military, to determine appropriate exposure levels to high temperatures. Similarly, the heat index (HI) is an index that combines air temperature and relative humidity in an attempt to determine the human-perceived equivalent temperature - how hot it feels, termed the felt air or "feels like" temperature. The wet-bulb temperature is the temperature one feels when one's skin is wet and is exposed to moving air. It is the lowest temperature that can be reached by the evaporation of water only, and is a type of temperature measurement that reflects the physical properties of a system with a mixture of a gas and a vapor, usually air and water vapor. All of the estimates provided were generated and are occasionally refined by Professor Philip M. Parker, INSEAD Chair Professor of Management Science.
Glossary
Wet Bulb Global Temperature: The Wet Bulb Globe Temperature (WBGT) is a composite temperature used to estimate the effect of temperature, humidity, wind speed (wind chill) and solar radiation on humans. It is used by various professions, including industrial hygienists, athletes, and the military, to determine appropriate exposure levels to high temperatures.
Heat Index: Similarly, the heat index (HI) is an index that combines air temperature and relative humidity in an attempt to determine the human-perceived equivalent temperature - how hot it feels, termed the felt air or "feels like" temperature.
Wet-Bulb Temperature: The wet-bulb temperature is the temperature one feels when one's skin is wet and is exposed to moving air. It is the lowest temperature that can be reached by the evaporation of water only, and is a type of temperature measurement that reflects the physical properties of a system with a mixture of a gas and a vapor, usually air and water vapor.
Beaufort Index: The Beaufort scale is an empirical measure that relates wind speed to observed conditions at sea or on land. Its full name is the Beaufort wind force scale, although it is a measure of wind speed and not of force in the scientific sense.
| Beaufort number | Description | Wind speed | Wave height | Sea conditions | Land conditions |
|---|---|---|---|---|---|
| 0 | Calm | < 1 km/h | 0 m | Flat. | Calm. Smoke rises vertically. |
| < 1 mph | |||||
| < 1 knot | 0 ft | ||||
| < 0.3 m/s | |||||
| 1 | Light air | 1.1–5.5 km/h | 0–0.2 m | Ripples without crests. | Smoke drift indicates wind direction. Leaves and wind vanes are stationary. |
| 1–3 mph | |||||
| 1–3 knot | 0–1 ft | ||||
| 0.3–1.5 m/s | |||||
| 2 | Light breeze | 5.6–11 km/h | 0.2–0.5 m | Small wavelets. Crests of glassy appearance, not breaking | Wind felt on exposed skin. Leaves rustle. Wind vanes begin to move. |
| 4–7 mph | |||||
| 4–6 knot | 1–2 ft | ||||
| 1.6–3.4 m/s | |||||
| 3 | Gentle breeze | 12–19 km/h | 0.5–1 m | Large wavelets. Crests begin to break; scattered whitecaps | Leaves and small twigs constantly moving, light flags extended. |
| 8–12 mph | |||||
| 7–10 knot | 2–3.5 ft | ||||
| 3.5–5.4 m/s | |||||
| 4 | Moderate breeze | 20–28 km/h | 1–2 m | Small waves with breaking crests. Fairly frequent whitecaps. | Dust and loose paper raised. Small branches begin to move. |
| 13–17 mph | |||||
| 11–16 knot | 3.5–6 ft | ||||
| 5.5–7.9 m/s | |||||
| 5 | Fresh breeze | 29–38 km/h | 2–3 m | Moderate waves of some length. Many whitecaps. Small amounts of spray. | Branches of a moderate size move. Small trees in leaf begin to sway. |
| 18–24 mph | |||||
| 17–21 knot | 6–9 ft | ||||
| 8.0–10.7 m/s | |||||
| 6 | Strong breeze | 39–49 km/h | 3–4 m | Long waves begin to form. White foam crests are very frequent. Some airborne spray is present. | Large branches in motion. Whistling heard in overhead wires. Umbrella use becomes difficult. Empty plastic bins tip over. |
| 25–30 mph | |||||
| 22–27 knot | 9–13 ft | ||||
| 10.8–13.8 m/s | |||||
| 7 | High wind, moderate gale, near gale | 50–61 km/h | 4–5.5 m | Sea heaps up. Some foam from breaking waves is blown into streaks along wind direction. {Moderate amounts of airborne spray. | Whole trees in motion. Effort needed to walk against the wind. |
| 31–38 mph | |||||
| 28–33 knot | 13–19 ft | ||||
| 13.9–17.1 m/s | |||||
| 8 | Gale, fresh gale | 62–74 km/h | 5.5–7.5 m | Moderately high waves with breaking crests forming spindrift. Well-marked streaks of foam are blown along wind direction. Considerable airborne spray. | Some twigs broken from trees. Cars veer on road. Progress on foot is seriously impeded. |
| 39–46 mph | |||||
| 34–40 knot | 18–25 ft | ||||
| 17.2–20.7 m/s | |||||
| 9 | Strong gale | 75–88 km/h | 7–10 m | High waves whose crests sometimes roll over. Dense foam is blown along wind direction. Large amounts of airborne spray may begin to reduce visibility. | Some branches break off trees, and some small trees blow over. Construction/temporary signs and barricades blow over. |
| 47–54 mph | |||||
| 41–47 knot | 23–32 ft | ||||
| 20.8–24.4 m/s | |||||
| 10 | Storm, whole gale | 89–102 km/h | 9–12.5 m | Very high waves with overhanging crests. Large patches of foam from wave crests give the sea a white appearance. Considerable tumbling of waves with heavy impact. Large amounts of airborne spray reduce visibility. | Trees are broken off or uprooted, structural damage likely. |
| 55–63 mph | |||||
| 48–55 knot | 29–41 ft | ||||
| 24.5–28.4 m/s | |||||
| 11 | Violent storm | 103–117 km/h | 11.5–16 m | Exceptionally high waves. Very large patches of foam, driven before the wind, cover much of the sea surface. Very large amounts of airborne spray severely reduce visibility. | Widespread vegetation and structural damage likely. |
| 64–73 mph | |||||
| 56–63 knot | 37–52 ft | ||||
| 28.5–32.6 m/s | |||||
| 12 | Hurricane force | ≥ 118 km/h | ≥ 14 m | Huge waves. Sea is completely white with foam and spray. Air is filled with driving spray, greatly reducing visibility. | Severe widespread damage to vegetation and structures. Debris and unsecured objects are hurled about. |
| ≥ 74 mph | |||||
| ≥ 64 knot | ≥ 46 ft | ||||
| ≥ 32.7 m/s |
| Contents |
|---|
| Regional Probability Forecast |
Regional Probability Forecast
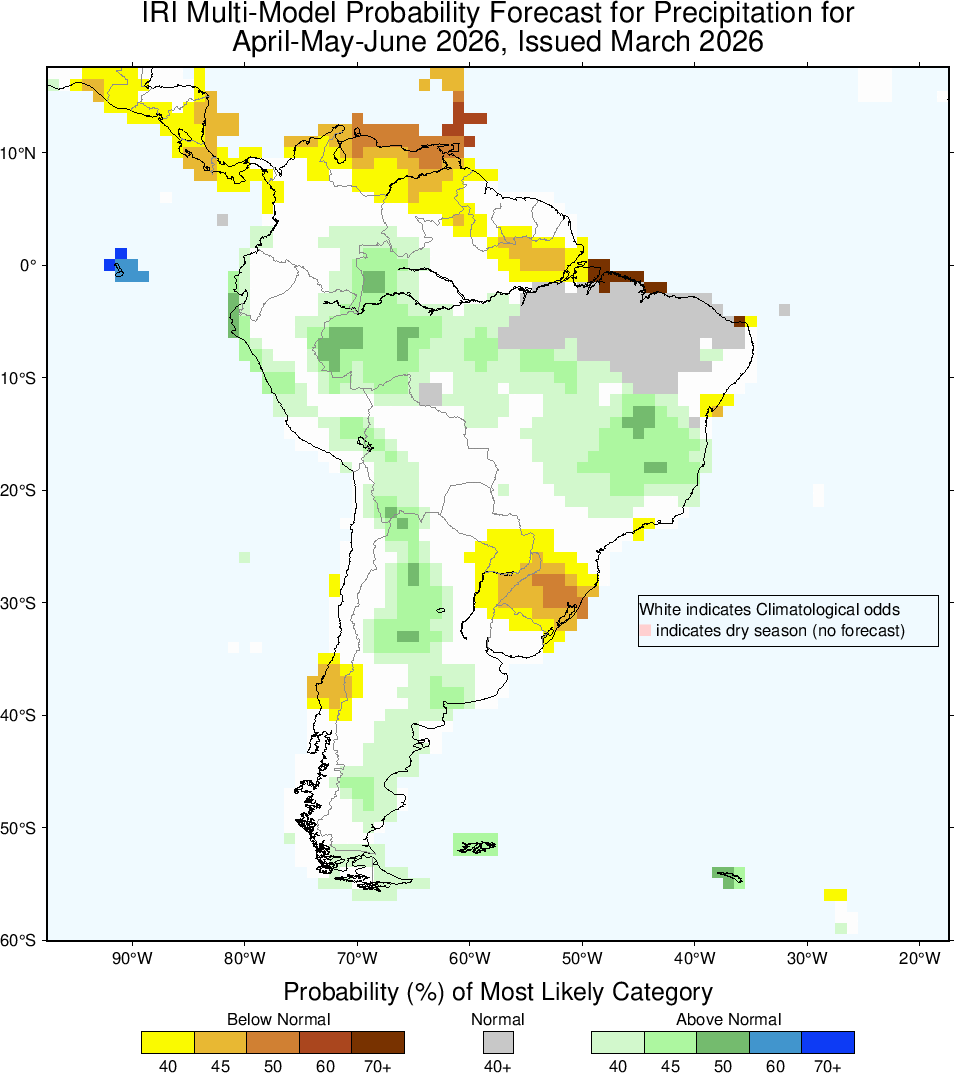

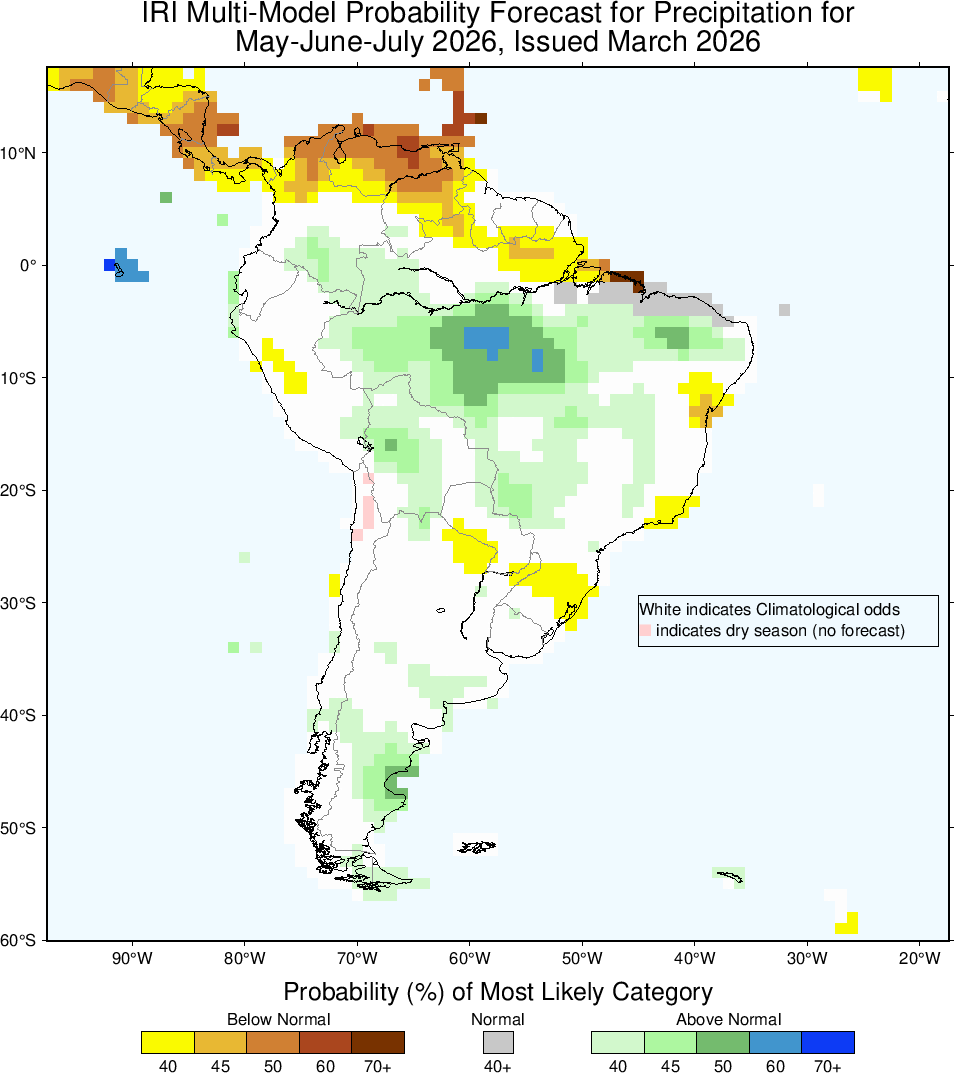

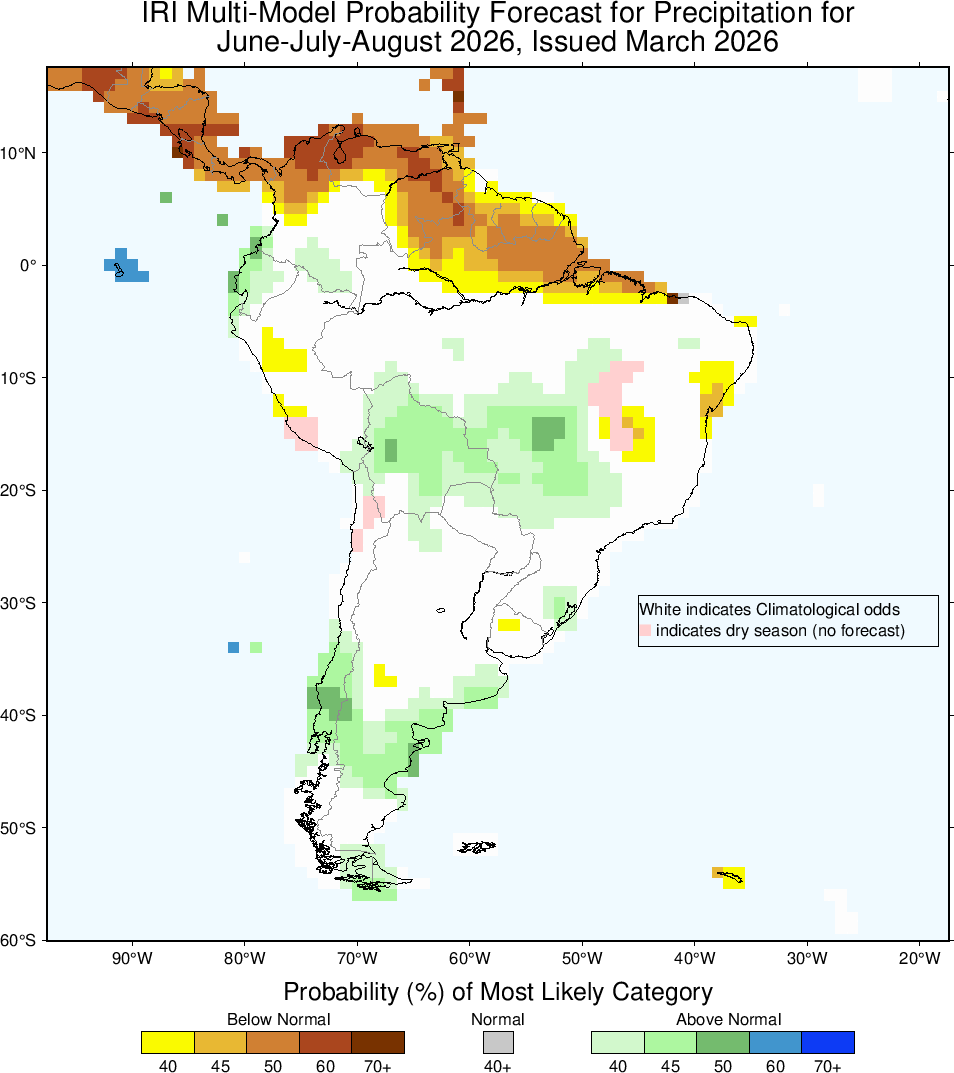

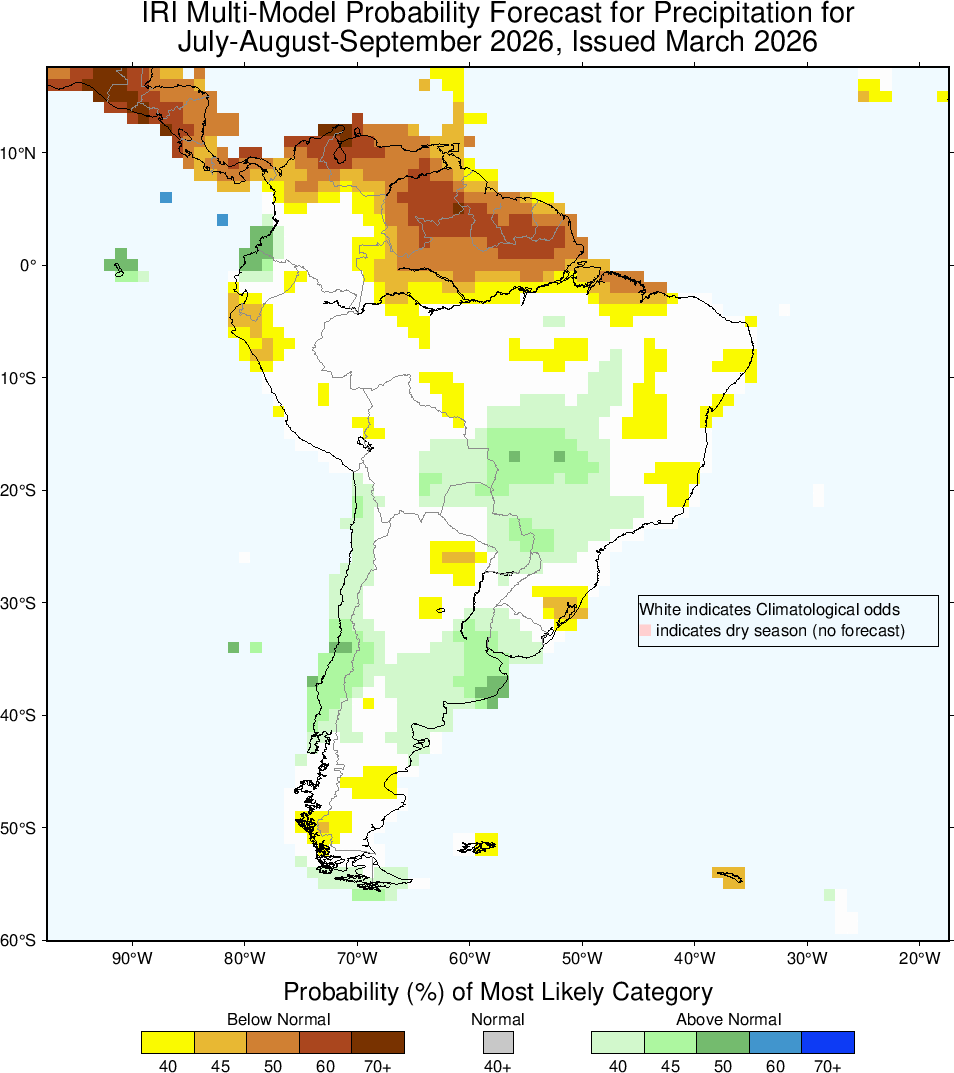

Map
Charts
Correlations
Regions
Results: 8

Audio - Tecpán Guatemala
If you would like to have weather audio in your language, please contact us.
Source & Methodology
The raw input for the forecasts presented here rely on satellite and ground station observations. Information is updated every 15 to 20 minutes; these may be extrapolated, based on proximity to observation areas, for a given location. The raw weather feeds are licensed from FORECA Ltd. They use several numerical weather prediction models from different sources and data centers, and select the most reliable ones according to internal research as well as research and opinions of leading scientists in meteorology. Different sources and models are used for different areas, forecast lengths, parameters, and sometimes even for different situations. Currently for most of the world, including Africa, FORECA heavily relies upon ECMWF (see www.ecmwf.int) data. Longer forecasts (3-4 days and longer), there is a partial use of ECMWF Ensemble probabilistic model data. GFS data is used for some areas and forecast lengths, both Deterministic and Ensemble. ECMWF documentation is available at: http://www.ecmwf.int/research/ifsdocs/. From raw numerical models, point forecasts are produced with proprietary methods, using, for example, statistical filtering with observations, land/sea features, and topography to arrive at individual point forecasts. ECMWF computational resolution is currently approximately 16 km, and is analyzed in a 13 km grid. A comparison of ECMWF with GFS is available at: http://www.emc.ncep.noaa.gov/gmb/STATS/html/sjl.rnmn.html, and http://www.emc.ncep.noaa.gov/gmb/STATS/html/aczd357.html. More verification discussion is available at: http://www.emc.ncep.noaa.gov/gmb/STATS/STATS.html.